For generations, our tax dollars have served as shared investments in the programs and services that make our state a great place to live, work, and play. Tax dollars enable Montanans to work together for those things, which we cannot achieve alone – a quality education for our children, the development and maintenance of infrastructure, public safety through police and fire protection, and clean air and water. These shared investments pave the way to a stronger economy where every Montanan can thrive.
This report, and every report in the Revenue Series, looks at how Montana raises tax dollars and who shares in the costs of our public investments.
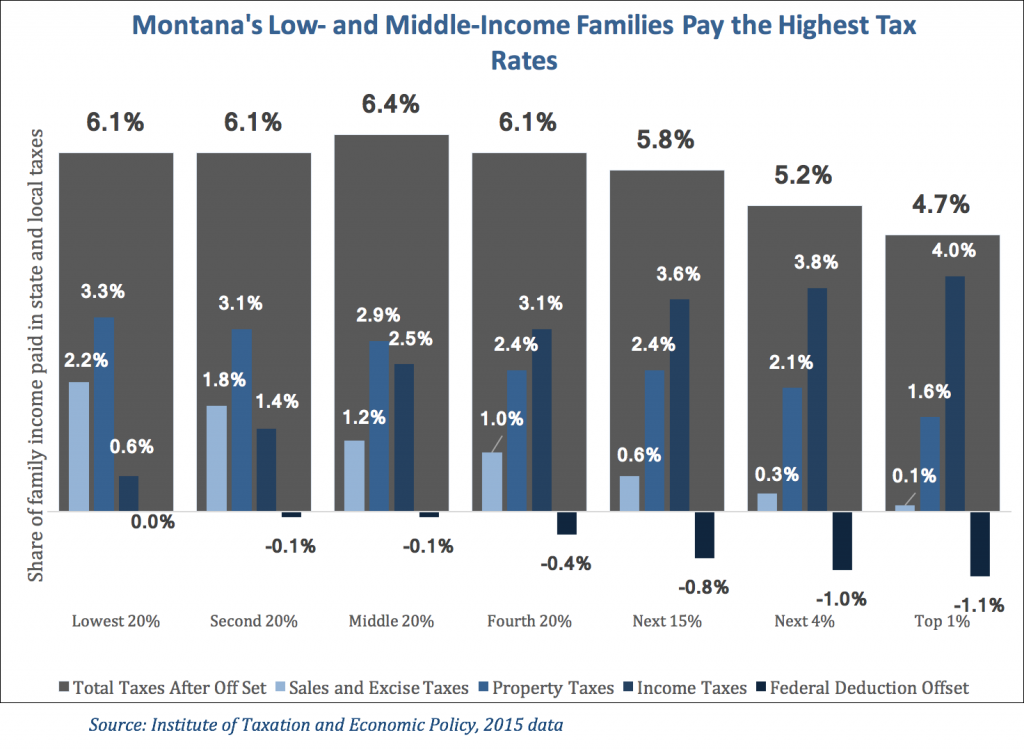
One way to evaluate a tax system is to look at how that system affects different households based on how much income they make. An analysis of Montana’s state and local taxes reveals that low-income Montanans pay higher taxes rates than those with higher incomes. In other words, Montana’s tax system is regressive. In Montana, those with incomes below $19,000 pay 6.1 percent of their income in state and local taxes, while those with income above $435,000 pay 4.7 percent (Chart 1).
Regressive Tax System – a system in which lower-income households pay a larger portion of their income in taxes compared to those households with higher incomes.
Progressive Tax System – a system in which higher-income households pay a larger portion of their income in taxes compared to those households with lower incomes.
Policy makers have several options to ease the regressivity of Montana’s tax system. Such measures include:
Policy Basics is a series of background reports on issues related to the Montana budget and Montana taxes. The purpose of the Policy Basics series is to provide the public, advocates, and policy makers the tools they need to effectively engage in important fiscal policy debates that help shape the health and safety of our communities.
Each of these options is discussed in the separate reports of MBPC’s Revenue Series that explain each type of tax.

| Income Group | Lowest 20% | Second 20% |
Middle 20% |
Fourth 20% |
Top 20% | ||||||||
| Next 15% | Next 4% | Top 1% | |||||||||||
| Income Range | Less than $19,000 | $19000-$34000 | $34,000-$54,000 | $54,000-$86,000 | $86,000-$157,000 | $157,000-$435,000 | $435,000+ | ||||||
| Average income in group | $10,500 | $25,700 | $42,300 | $67,300 | $111,300 | $240,600 | $1,047,500 | ||||||
| Sales and Excise Taxes | 2.2% | 1.8% | 1.2% | 1.0% | 0.6% | 0.3% | 0.1% | ||||||
| General Sales - Individuals | - | - | - | - | - | - | - | ||||||
| Other Sales and Excise - Ind. | 1.8% | 1.5% | 1.0% | 0.8% | 0.5% | 0.3% | 0.1% | ||||||
| Sales and Excise on Business | 0.3% | 0.3% | 0.3% | 0.2% | 0.1% | 0.1% | 0.0% | ||||||
| Property Taxes | 3.3% | 3.1% | 2.9% | 2.4% | 2.4% | 2.1% | 1.6% | ||||||
| Property Taxes on Families | 2.9% | 2.5% | 2.3% | 1.9% | 1.8% | 1.2% | 0.6% | ||||||
| Other Property Taxes | 0.5% | 0.6% | 0.6% | 0.5% | 0.5% | 0.8% | 1.1% | ||||||
| Income Taxes | 0.6% | 1.4% | 2.5% | 3.1% | 3.6% | 3.8% | 4.0% | ||||||
| Personal Income Tax | 0.6% | 1.3% | 2.4% | 3.1% | 3.5% | 3.7% | 3.8% | ||||||
| Corporate Income Tax | 0.0% | 0.0% | 0.0% | 0.0% | 0.0% | 0.1% | 0.2% | ||||||
| Total Taxes | 6.1% | 6.2% | 6.6% | 6.5% | 6.6% | 6.2% | 5.8% | ||||||
| Federal Deduction Offset | 0.0% | -0.1% | -0.1% | -0.4% | -0.8% | -1.0% | -1.1% | ||||||
| Total Taxes After Offset | 6.1% | 6.1% | 6.4% | 6.1% | 5.8% | 5.2% | 4.7% | ||||||

MBPC is a nonprofit organization focused on providing credible and timely research and analysis on budget, tax, and economic issues that impact low- and moderate-income Montana families.