Policy Basics is a series of background reports on issues related to the Montana budget and Montana taxes. The purpose of the Policy Basics series is to provide the public, advocates, and policymakers the tools they need to effectively engage in important fiscal policy debates that help shape the health and safety of our communities.
Introduction to Montana’s Individual Income Tax
For generations, our tax dollars have served as shared investments in the programs and services that make our state a great place to live, work, and play. Tax dollars enable Montanans to work together for those things which we could not achieve alone - educate our children, build and maintain infrastructure, provide public safety through police and fire protection, keep our air and water clean, and pave the way to a strong economy where every Montanan can thrive.
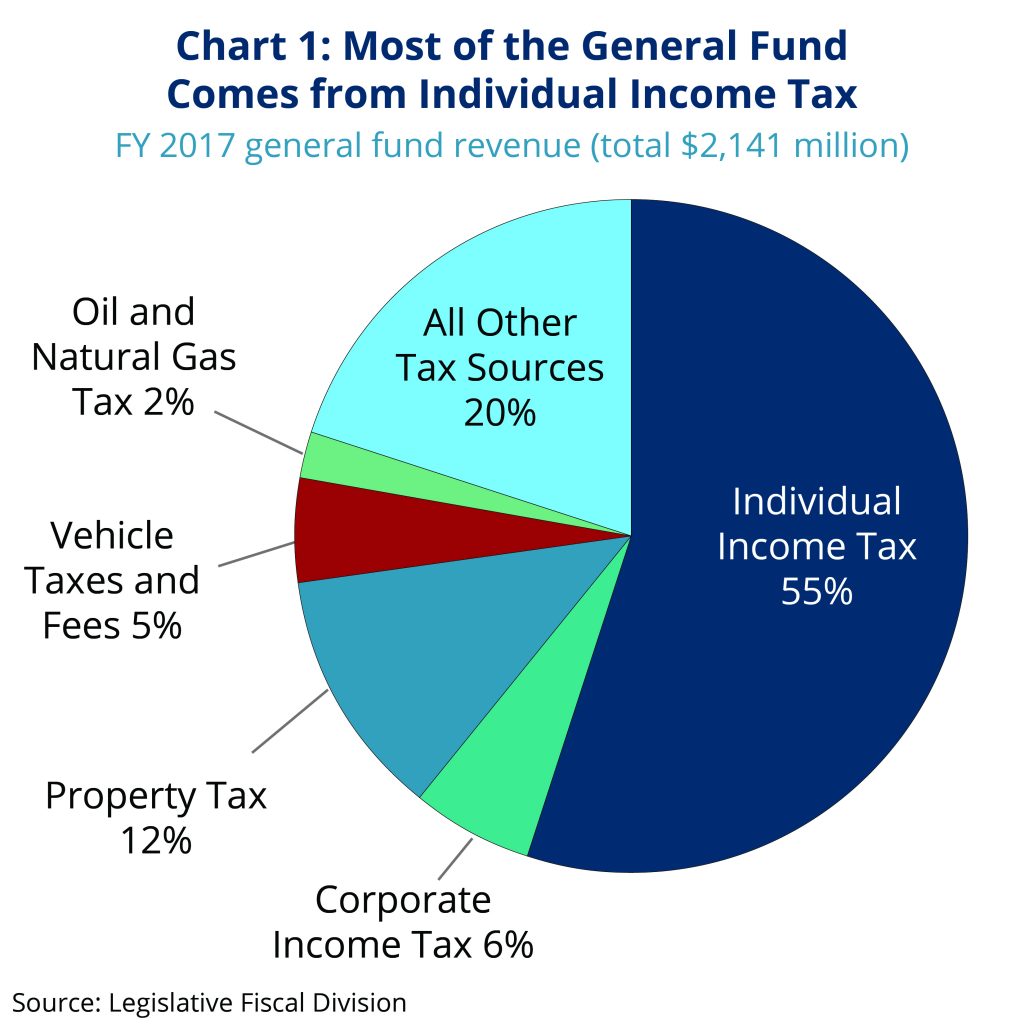
In Montana, these shared investments are managed through the state’s General Fund. Taxes make up the vast majority (94 percent) of the revenue for the General Fund, and the individual income tax is the single largest source of revenue for the General Fund, comprising just over half of the state’s General Fund revenue (Chart 1). [1]
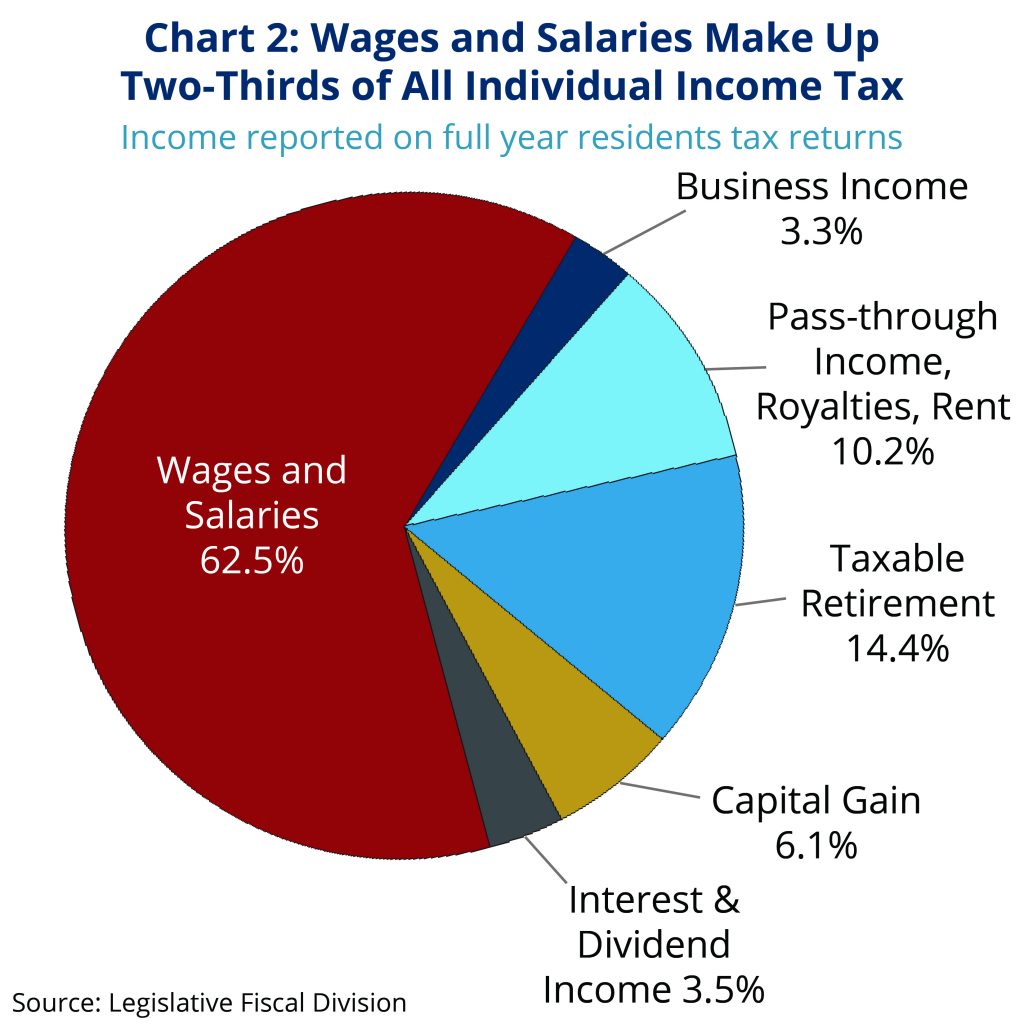
Wages, salaries, and tips make up almost two-thirds (63 percent) of income subject to individual income tax (Chart 2).[2] In general, taxes paid by corporations are paid through the corporate income tax. However, depending on how the entity is structured, business income may be reported through the individual income tax. Specifically, if the business is structured as a C-corporation in order to receive the legal benefits associated with such a status (including limited liability for debts and business actions and access to capital markets), its taxes would be classified as corporate income taxes. All other businesses, including sole proprietorships, partnerships, limited liability corporations, and S-corporations, report income on individual returns, and this amount is reflected in both pass-through income and business income, which comprises less than 14 percent of total individual income.[3]
| Key Terms
Progressive refers to a tax or a tax system in which higher-income households pay a larger portion of their income in taxes compared to those households with lower incomes. Regressive refers to a tax or tax system in which lower-income households pay a larger portion of their income in taxes compared to those households with higher incomes. |
2003 Changes to the Montana Income Tax Significantly Cut Taxes for Wealthiest Households
In 2003, the Montana Legislature made significant and harmful changes to our income tax system. That year, legislators passed a bill that greatly altered Montana’s tax system by providing a significant tax cut for wealthiest households.[4] The changes made in 2003 included collapsing the income tax brackets and creating a tax cut for capital gains income. Both of these provisions make our tax system more regressive, giving a greater tax cut to high-income households and costing the state nearly a billion dollars in revenue that could have been used to invest in our future.
Due to tax changes made in 2003, an individual earning just above the minimum wage now the same top marginal tax rate as someone making $1 million.
Bracket Collapse Disproportionately Benefits Wealthiest
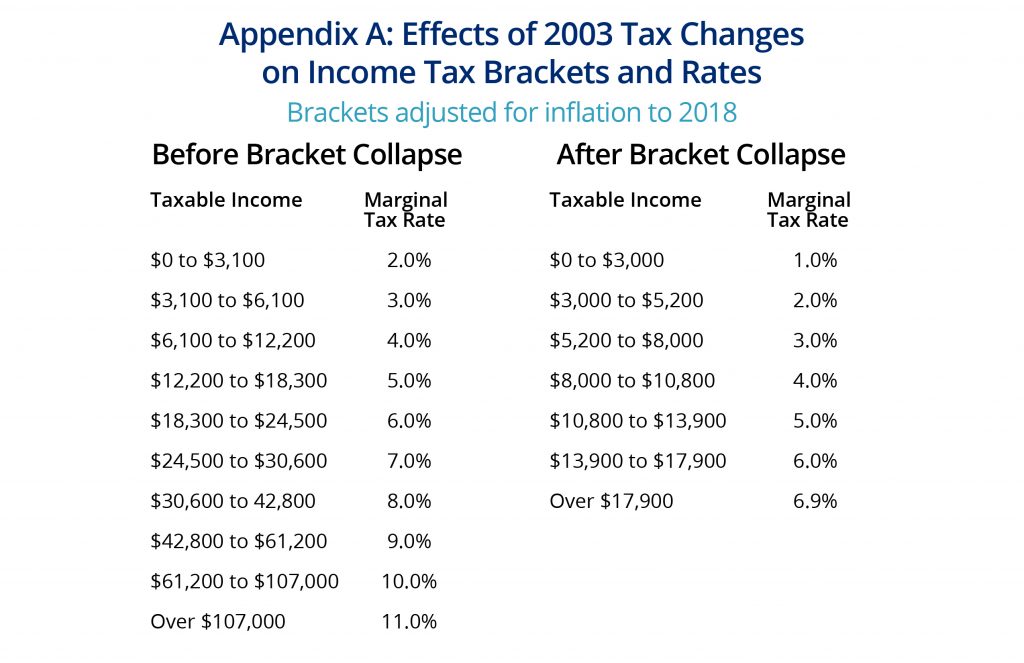
Prior to the tax cuts implemented in 2003, Montana had ten different income brackets, with each higher income bracket paying a slightly larger share of their income in taxes (Appendix A).[5] In this old structure, the lowest income bracket paid two percent of their income in taxes, while the highest bracket (applying to incomes over $107,000, adjusted for 2018) paid 11 percent of that income in taxes.[6]
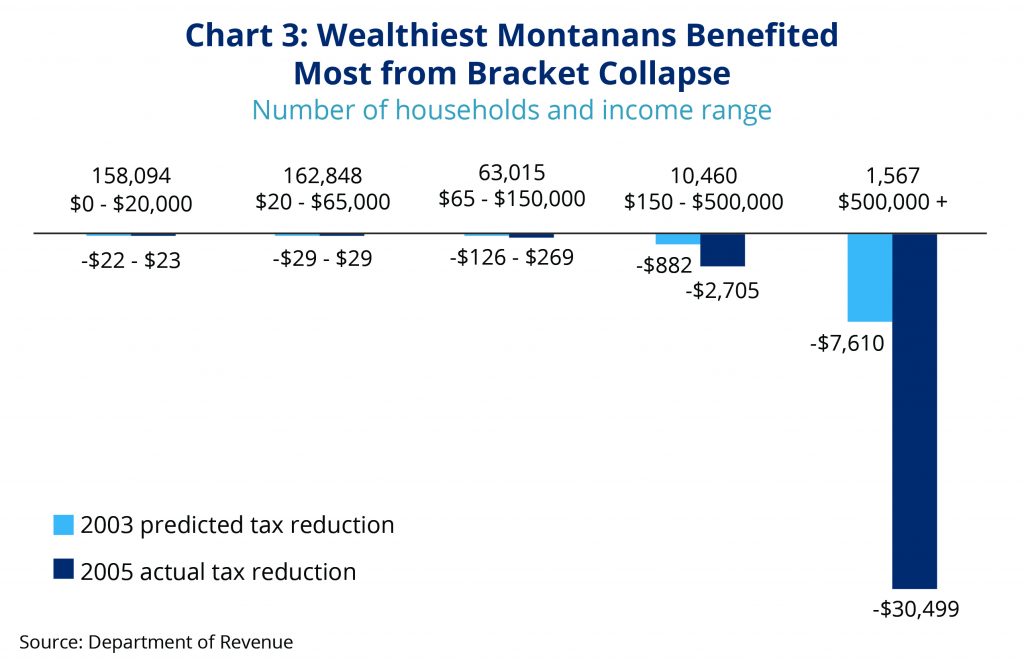
The changes in 2003 reduced the total number of income brackets to seven. In 2018, the top bracket now includes all households making over $17,900.[7] That means someone earning just above the minimum wage now faces the same top marginal tax rate as someone making $1 million. As a result of the 2003 tax cuts, the wealthiest households experienced the greatest tax reductions. More than half the reduction in income taxes went to households with incomes of over $500,000, the top 0.4 percent of taxpayers, whose average tax reduction was $30,499. For the bottom 81 percent of Montana taxpayers, the average tax cut was just $23 (Chart 3).[8]
As a whole, these tax cuts have created a more regressive income tax structure. In fact, while our individual income tax remains slightly progressive, it is not progressive enough to offset the regressivity of our property taxes and selective sales and excise taxes.[9] In other words, when looking at the entire tax system in Montana, lower-income taxpayers pay a larger portion of their income in taxes compared to those with higher incomes.
The changes made have also had a negative impact on Montana’s revenue streams. In the past decade, it is estimated that the state has lost one billion dollars in revenue due to the 2003 tax cuts.[10] This lost revenue could have been used to educate our children, keep our communities safe, and protect our land and water instead of cutting taxes for those who need it the least.
For further information about the income tax bracket collapse, see Montana Budget and Policy Center’s (MBPC) report, The Montana We Could Be: Tax cuts, aimed at the rich, take a toll.
| Key Term
Capital Gains are income from the sale of an asset, such as stocks, bonds, vacation homes, art, or a business. Capital gains income is only “realized” when the asset is sold for a profit. As long as the investor continues to own the asset, any increase in value is not considered income. The first $500,000 in capital gains from primary residences is not taxed. Likewise, profits from the sale of an individual retirement account are not treated as capital gains. |
Currently, Montana is one of only six states that offer significant tax breaks for capital gains.[11] The capital gains credit has proven to be unaffordable, is unfair to Montanans who earn income through wages, and has not benefited the Montana economy.[12]
The capital gains credit lowers the effective tax rate for people who earn income through investments compared to those who earn income from wages. This creates a tax system that favors wealth over work. In 2016, half of the benefits from the credit went to the wealthiest one percent of taxpayers (just 4,600 households in Montana).[13],[14]
Nearly all middle- and lower-income Montanans do not benefit from the credit because they are much more likely to earn their income on the job rather than through the sale of large assets. In 2015, over 85 percent of Montana taxpayers – more than 476,000 taxpayers – did not receive any benefit from the capital gains credit.[15] In fact, the assets owned by most Montanans – primary residences and retirement funds – are not treated as capital gains income when they are sold.
Economic theory and experience teach us that treating capital gains more favorably than wages will not help the economy. In fact, the lost tax revenue could actually prevent growth by forcing state budget cuts. The capital gains credit cost Montana an estimated $35 million in 2015.[16] These vital dollars could have been used to fund growth-oriented services like education, healthcare, and environmental protections.
For more information see MBPC’s report, Capital Gains Tax Credit: Valuing Wealth Over Work in Montana.
Earned Income Tax Credit Makes Work Pay
In 2017, the Montana Legislature passed a state earned income tax credit (EITC) making Montana the 29th state to create a state EITC to support working families make ends meet.[17] Beginning in 2019, Montana will provide a refundable tax credit set at three percent of the federal EITC to low- and moderate-income households, offering a maximum benefit of $192. Approximately 80,000 Montana families that earn income through work are eligible to receive the state EITC.[18]
Prior to the 2017 session, Montana’s income tax structure placed one the highest burdens in the nation on families living in poverty.[19] A state EITC keeps families working and out of poverty, but Montana can do more to improve the economic security of low-income families by increasing the credit amount. Among the 29 states and District of Columbia that offer a state EITC, Montana’s three percent credit is the lowest.[20] Raising the value of the credit to 10 percent of the federal credit, similar to Colorado and Nebraska, would result in a maximum benefit of $643, and will go further in helping families meet their basic needs.
For more information see MBPC’s report, A State Earned Income Tax Credit: Helping Montana's Working Families and Economy.
Deduction for Federal Taxes Paid
Montana is one of just six states that still has a deduction for federal income taxes paid, a deduction that disproportionately benefits the highest income earners in the state and costs the state much-needed revenue.[21] In 2015, this deduction cost nearly $66.7 million.[22]
The deduction for federal taxes paid is an unusual tax break that allows taxpayers to deduct the federal taxes they pay from their Montana taxable income. The deduction is only available to those who utilize itemized deductions and is capped at $5,000 for a single taxpayer and $10,000 for married taxpayers filing a joint return.[23]
Eliminating this deduction would impact a little more than one-third of taxpayers overall, with over two-thirds of the tax increase going to the top 20 percent of taxpayers. Halving the deduction from $5,000 to $2,500 per spouse would generate $27 million in revenue for the state.[24]
Income Taxes in Indian Country
Generally, all individual tribal members are subject to federal income taxes. The exception to this is income derived directly from allotted trust lands or treaty fishing rights.[25] In Montana, tribal members are also subject to state income taxes if they live or work off the reservation where they are enrolled.[26] In 2010, 39 percent of American Indians resided off-reservation in Montana, and many more American Indians living on their reservation were working in nearby communities.[27]
Federally recognized tribal governments do not pay state income taxes because states cannot tax Indian tribes in Indian Country.[28] Thus, federally recognized tribes receive the same income tax exemption as federal and state governments. However, income generated by state-recognized tribes or through tribal corporations chartered under state law is subject to federal and state income taxation.[29]
Tribal governments, like federal and state governments, have the right to tax the income of their own members, but few, if any, actually do. Each tribe has its own reasons stemming from its unique history and cultural views on the matter. However, widespread poverty and high rates of unemployment common on many reservations plays into the unfeasibility of taxing tribal member income. In Montana, the combined average of reservation-residing American Indians living in poverty between 2011 and 2015 was 34 percent.[30] Likewise, the Bureau of Indian Affairs estimates that tribal member unemployment was as high as 70 percent on some reservations in the state in 2005.[31]
For more information see MBPC’s report series Policy Basics: Taxes in Indian Country Part 1: Individual Tribal Members and Policy Basics: Taxes in Indian Country Part 2: Tribal Governments.
Conclusion: Reforms for a Stronger Montana
Our income tax system is one of the primary ways that we pool our resources to make investments in public services and infrastructure that help make our communities stronger, safer, healthier, and more prosperous. The following reforms would greatly strengthen Montana’s income tax system:
Montana needs a modern income tax system that makes continued investment in our communities and economy, paving the way for a more prosperous future for our children and grandchildren.
MBPC is a nonprofit organization focused on providing credible and timely research and analysis on budget, tax, and economic issues that impact low- and moderate-income Montana families.