Policy Basics is a series of background reports on issues related to the Montana budget and Montana taxes. The purpose of the Policy Basics series is to provide the public, advocates, and policy makers the tools they need to effectively engage in important fiscal policy debates that help shape the health and safety of our communities.
For generations, our tax dollars have served as shared investments in the programs and services that make our state a great place to live, work, and play. Tax dollars enable Montanans to work together for those things which we could not achieve alone - educate our children, build and maintain infrastructure, provide public safety through policy and fire protection, keep our air and water clean, and pave the way to a strong economy where every Montanan can thrive.
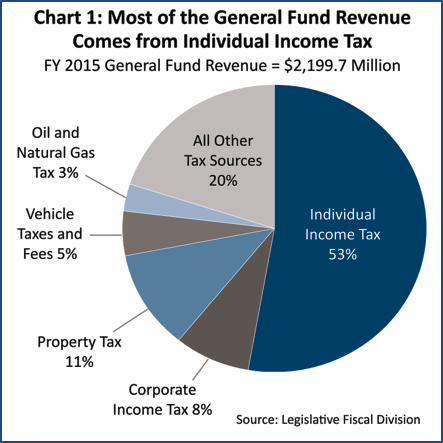
In Montana, these shared investments are managed through the state’s “general fund.” Taxes make up the vast majority (96%) of the revenue for the General Fund,[1] and the individual income tax is the single largest source of revenue for the general fund, comprising just over half of the state’s tax revenue (Chart 1).
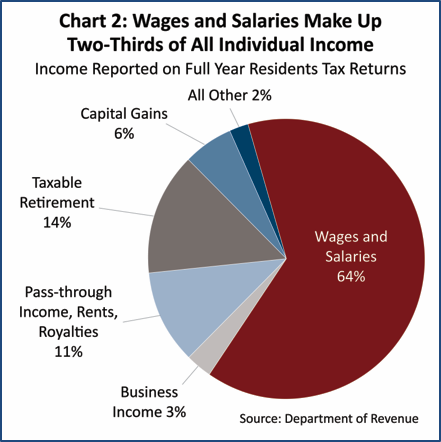
Taxes paid on wages, salaries, and tips made up almost two-thirds (64%) of income subject to individual income tax (Chart 2).[2] In general, taxes paid by corporations are paid through the corporate income tax. However, depending on how the entity is structured, business income may actually be reported through the individual income tax. Specifically, if the business is structured as a C corporation in order to receive the legal benefits associated with such a status (including limited liability for debts and business actions and access to capital markets), its taxes would be classified as corporate taxes.
In 2003, the Montana Legislature made significant and harmful changes to our income tax system. That year, legislators passed a bill that greatly altered Montana’s tax system, providing a significant tax cut for wealthiest households.[4] The changes made in 2003 included collapsing the income tax brackets and creating a tax cut for capital gains income. Both of these provisions make our tax system more regressive, giving a greater tax cut to high-income households, and cost the state nearly a billion dollars in revenue that could have been used to invest in our future.
Progressive – refers to a tax or a tax system in which higher-income households pay a larger portion of their income in taxes compared to those households with lower incomes.
Regressive – refers to a tax or tax system in which lower-income households pay a larger portion of their income in taxes compared to those households with higher incomes.
Prior to the tax cuts implemented in 2003, Montana had ten different income brackets, with each higher income bracket paying a slightly larger share of their income in taxes (Appendix A).[5] In this old structure, the lowest income bracket paid 2% of their income in taxes, while the highest bracket (applying to incomes over $102,000, adjusted for 2015) paid 11% of that income in taxes.[6]
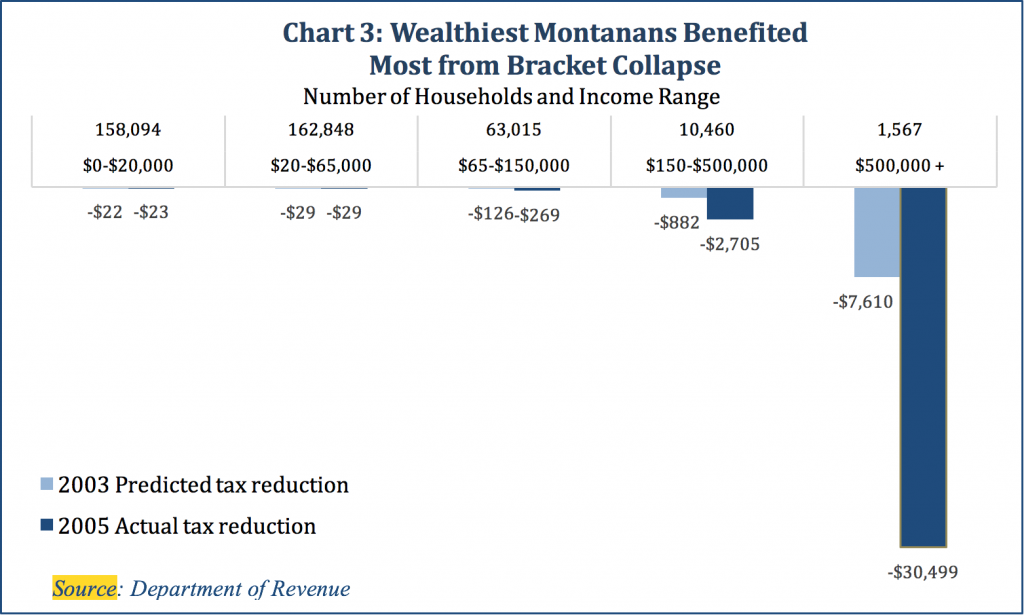
The changes in 2003 reduced the total number of income brackets to six. In 2015, the top bracket now includes all households making over $17,100.[7] That means someone earning just above the minimum wage now faces the same top marginal tax rate as someone making $1 million. As a result of the 2003 tax cuts, the wealthiest households experienced the greatest tax reductions. For those with incomes of over $500,000, the top 0.4% of taxpayers, the average tax reduction was $30,499. For the bottom 81% of Montana taxpayers, the average tax cut was just $23 (Chart 3).[8]
As a whole, the bracket collapse has created a more regressive income tax structure. In fact, while our individual income tax remains slightly progressive, it is not progressive enough to offset the regressivity of our property taxes and selective sales and excise taxes.[9] In other words, when looking at the entire tax system in Montana, lower-income taxpayers pay a larger portion of their income in taxes compared to those with higher incomes.
The changes made have also had a negative impact on Montana’s revenue streams. In the past decade, it is estimated that the state has lost one billion dollars in revenue due to the bracket collapse.[10] This lost revenue could have been used to educate our children, keep our communities safe, and protect our land and water instead of reducing taxes for those who need it the least. For further information about the income tax bracket collapse, see Montana Budget and Policy Center’s report, The Montana We Could Be: Tax cuts, aimed at the rich, take a toll.
Capital Gains Credit Favors Wealth Over Work
Currently, Montana is one of only nine states that offer significant tax breaks for capital gains.[11] The capital gains credit has proven to be unaffordable, is unfair to Montanans who earn income through wages, and has not benefited the Montana economy.[12]
Capital Gains – Capital gains are income from the sale of an asset, such as stocks, bonds, vacation homes, art, a business, etc. Capital gains income is only “realized” when the asset is sold for a profit. As long as the investor continues to own the asset, any increase in value is not considered income. Capital gains are taxed only when the asset is sold. The first $500,000 in capital gains from primary residences is not taxed. Likewise, profits from the sale of an individual retirement account are not treated as capital gains.
The capital gains credit lowers the effective tax rate for people who earn income through investments compared to those who earn income from wages. This creates a tax system that favors wealth over work. Eighty seven percent of the benefits from the credit go to the top 20% of taxpayers, with half of the capital gains tax cut going to the wealthiest 4,500 taxpayers (households with income over $365,000).[13],[14]
Nearly all middle and lower income Montanans do not benefit from the credit because they are much more likely to earn their income on the job rather than through the sale of large assets. In 2013, over 85% of Montana taxpayers – more than 468,000 taxpayers – did not receive any benefit from the capital gains credit.[15] In fact, the assets owned by most Montanans - primary residences and retirement funds – are not treated as capital gains income when they are sold.
Economic theory and experience teach us that treating capital gains more favorably than wages will not help the economy. In fact, the lost tax revenue could actually prevent growth by forcing state budget cuts. The capital gains credit cost Montana an estimated $29 million in 2013.[16] These vital dollars could have been used to fund growth-oriented services like education, healthcare and environmental protections. For further information see Montana Budget and Policy Center’s report, Ending Preferential Treatment of Capital Gains Income.
Income Tax Threshold – The income tax threshold is the amount of family income at which a household first begins to owe income taxes.
In Montana, our income tax system makes it even harder for many low-income, working families to provide for their basic needs. By all measures, our income tax structure places one of the highest burdens in the nation on families living in poverty. Montana begins taxing a two-parent family with two children at a lower annual income than nearly all other states in the country.[17] We begin taxing such a family when their income reaches $13,480 per year (about 55 percent of the federal poverty level).[18]
We also tax the income of workers living in poverty at a higher rate than most other states. Montana single parent families with two children have a higher tax liability than all states except Georgia, Hawaii, and Alabama. This family would owe an average of $174 per year in Montana.[19] Most states do not impose income taxes on families living below the federal poverty line.[20] In fact, twenty-six states (and the District of Columbia) have enacted state earned-income tax credits to supplement the income of working families who fall below the poverty line.[21] Montana could substantially improve the tax treatment of low-income families by implementing a state Earned Income Tax Credit. For more information see Montana Budget and Policy Center’s report, Investing in Montana’s Working Families: A Montana Earned Income Tax Credit (EITC).
Montana is one of just six states that still has a deduction for federal income taxes paid, a deduction that disproportionately benefits the highest income earners in the state and costs the state much-needed revenue.[22] In 2013, this deduction cost nearly $67 million.[23]
The deduction for federal taxes paid is an unusual tax break that allows taxpayers to deduct the federal taxes they pay from their Montana taxable income. The deduction is only available to those who utilize itemized deductions and is capped at $5,000 for single ($10,000 for married) taxpayers.[24] This deduction was implemented in 1933 and no longer makes sense for Montana.[25]
Eliminating this deduction would impact a little more than one-third of taxpayers overall, with over two-thirds of the tax increase going to the top 20% of taxpayers. Halving the deduction from $5,000 to $2,500 per spouse is another option that would generate $27,200,000 in revenue for the state.[26]
Our income tax system is one of the primary ways that we pool our resources to make investments in public services and infrastructure that help make our communities stronger, safer, healthier, and more prosperous. The following reforms would greatly strengthen Montana’s income tax system:
Montana needs a modern income tax system that makes continued investment in our communities and economy, paving the way for a more prosperous future for our children and grandchildren.
Appendix A: Effects of 2003 Tax Changes on Income Tax Brackets and Rates
| Income Tax Rates | ||||
| Brackets Adjusted for Inflation to 2015 | ||||
| Before Bracket Collapse | After Bracket Collapse | |||
| Taxable Income | Marginal
Tax Rate |
Taxable Income | Marginal
Tax Rate |
|
| $0 to $2,900 | 2.0% | $0 to $2,800 | 1.0% | |
| $2,900 to $5,800 | 3.0% | $2,800 to $5,000 | 2.0% | |
| $5,800 to $11,500 | 4.0% | $5,000 to $7,600 | 3.0% | |
| $11,500 to $17,300 | 5.0% | $7,600 to $10,300 | 4.0% | |
| $17,300 to $23, 100 | 6.0% | $10,300 to $13,300 | 5.0% | |
| $23,100 to $28,900 | 7.0% | $13,300 to $17,100 | 6.0% | |
| $28,900 to $40,400 | 8.0% | Over $17,100 | 6.9% | |
| $40,400 to $57,700 | 9.0% | |||
| $57,700 to $101,000 | 10.0% | |||
| Over $101,000 | 11.0% | |||
Source: Department of Revenue
MBPC is a nonprofit organization focused on providing credible and timely research and analysis on budget, tax, and economic issues that impact low- and moderate-income Montana families.